
The Complete Guide to Futures Trading Journals: Why You Need One and How to Use It
Learn why keeping a trading journal is the #1 habit separating profitable futures traders from the rest. A step-by-step guide covering what to track, how to review, R-multiple and expectancy, rule-adherence tagging, and the analytics that actually improve your trading.

Introduction
Here's a stat that should keep every trader up at night: over 90% of futures traders lose money. Not because they lack market knowledge or a solid strategy—but because they keep making the same mistakes without ever realizing it.
The difference between consistently profitable traders and everyone else isn't a secret indicator or a magic strategy. It's self-awareness. And the single most effective tool for building that self-awareness is a trading journal.
If you've ever had a great trading week, felt invincible, then given it all back the next week with no idea what changed—you need a journal. If you've ever wondered whether you're actually better at trading mornings vs. afternoons, long vs. short, or NQ vs. ES—you need a journal. If you're managing multiple prop firm accounts and want to see your real edge across hundreds of trades—you definitely need a journal.
This guide covers everything: why journaling works, what to track, how to review your data, the common mistakes traders make, and how to turn raw trade data into actionable insights that actually improve your performance.
What Is a Trading Journal?
A trading journal is a structured record of every trade you take, combined with notes about your thought process, emotions, and market conditions. Think of it as a personal performance database.
At its simplest, a trading journal tracks:
- What you traded (symbol, direction, quantity)
- When you traded (entry/exit times, duration)
- How it went (P&L, points captured)
- Why you took the trade (setup, reasoning)
- How you felt (emotional state at entry and exit)
But a good journal goes much further. It becomes a feedback loop—a system that helps you identify patterns in your own behavior that you can't see in real time.
Here's the key insight: your trading journal isn't about recording history. It's about shaping your future.
Why Every Futures Trader Needs a Journal
1. You Can't Improve What You Don't Measure
Most traders have a vague sense of how they're doing. "I think I'm better at longs." "I feel like I trade worse on Fridays." But feelings aren't data.
A futures trading journal converts gut feelings into hard numbers. Instead of guessing, you can see that your long trades have a 62% win rate vs. 41% on shorts. You can see that your Friday P&L is -$2,340 over the last three months while Tuesday is +$5,120.
That's not a feeling—it's an edge you can act on.
2. It Breaks the Cycle of Repeated Mistakes
Every trader has patterns they fall into. Maybe you revenge trade after a loss. Maybe you size up too aggressively after a winning streak. Maybe you hold losers too long hoping they'll come back.
Without a journal, these patterns stay invisible. You make the same mistake on Monday, forget about it by Wednesday, and repeat it on Friday. A journal forces you to confront these patterns by putting them in writing.
When you write "I doubled my size after three wins and then gave back the entire day's profit," you're much less likely to do it again tomorrow.
3. It Builds Confidence in Your Strategy
One of the hardest things in trading is sticking to your plan during a drawdown. When you've lost 8 of your last 12 trades, every cell in your body screams to change something—switch strategies, take random setups, or stop trading entirely.
A journal with historical data gives you perspective. You can look back and see that your strategy has a 55% win rate over 500 trades with a 2.3 profit factor. The current losing streak is within normal statistical variance. That data-backed confidence keeps you in the game when emotions tell you to quit.
4. It Reveals Your Actual Edge
Many traders think they know where their edge comes from, but the data tells a different story. You might believe you're a great scalper, but your journal reveals that your best P&L comes from trades held 15-30 minutes—not the 2-minute scalps you're proud of.
Your journal shows you:
- Which symbols are most profitable for you
- What time of day you trade best
- What trade duration produces the best results
- Which setups (playbooks) have the highest win rate
- How streaks affect your subsequent performance
This isn't abstract—this is the roadmap to maximizing your strengths and eliminating your weaknesses.
5. It's Required for Serious Prop Firm Trading
If you're trading funded accounts at prop firms like Apex, Bulenox, or Take Profit Trader, journaling isn't optional—it's essential for survival. Prop firm accounts have strict drawdown rules, and understanding your risk patterns is the difference between keeping your funded account and blowing it.
A journal helps you identify:
- Which days you tend to overtrade (and should reduce size)
- Your average drawdown patterns so you can set appropriate daily loss limits
- Whether you're giving back too much profit before exiting trades
What to Track in Your Trading Journal
The Basics (Auto-Tracked)
These fields should be captured automatically—you shouldn't have to type them manually for every trade:
| Field | Why It Matters |
|---|---|
| Symbol | Know which markets you're actually profitable in |
| Direction (Long/Short) | Most traders have a directional bias |
| Entry/Exit Price | Calculate true slippage and execution quality |
| Entry/Exit Time | Identify your best and worst trading hours |
| Quantity | Track position sizing discipline |
| Net P&L | The bottom line |
| Duration | Know if you're holding too long or cutting too short |
| Commissions | The hidden drag on your P&L |
The Annotations (Your Edge)
This is where the real value lives—the qualitative data that only you can provide:
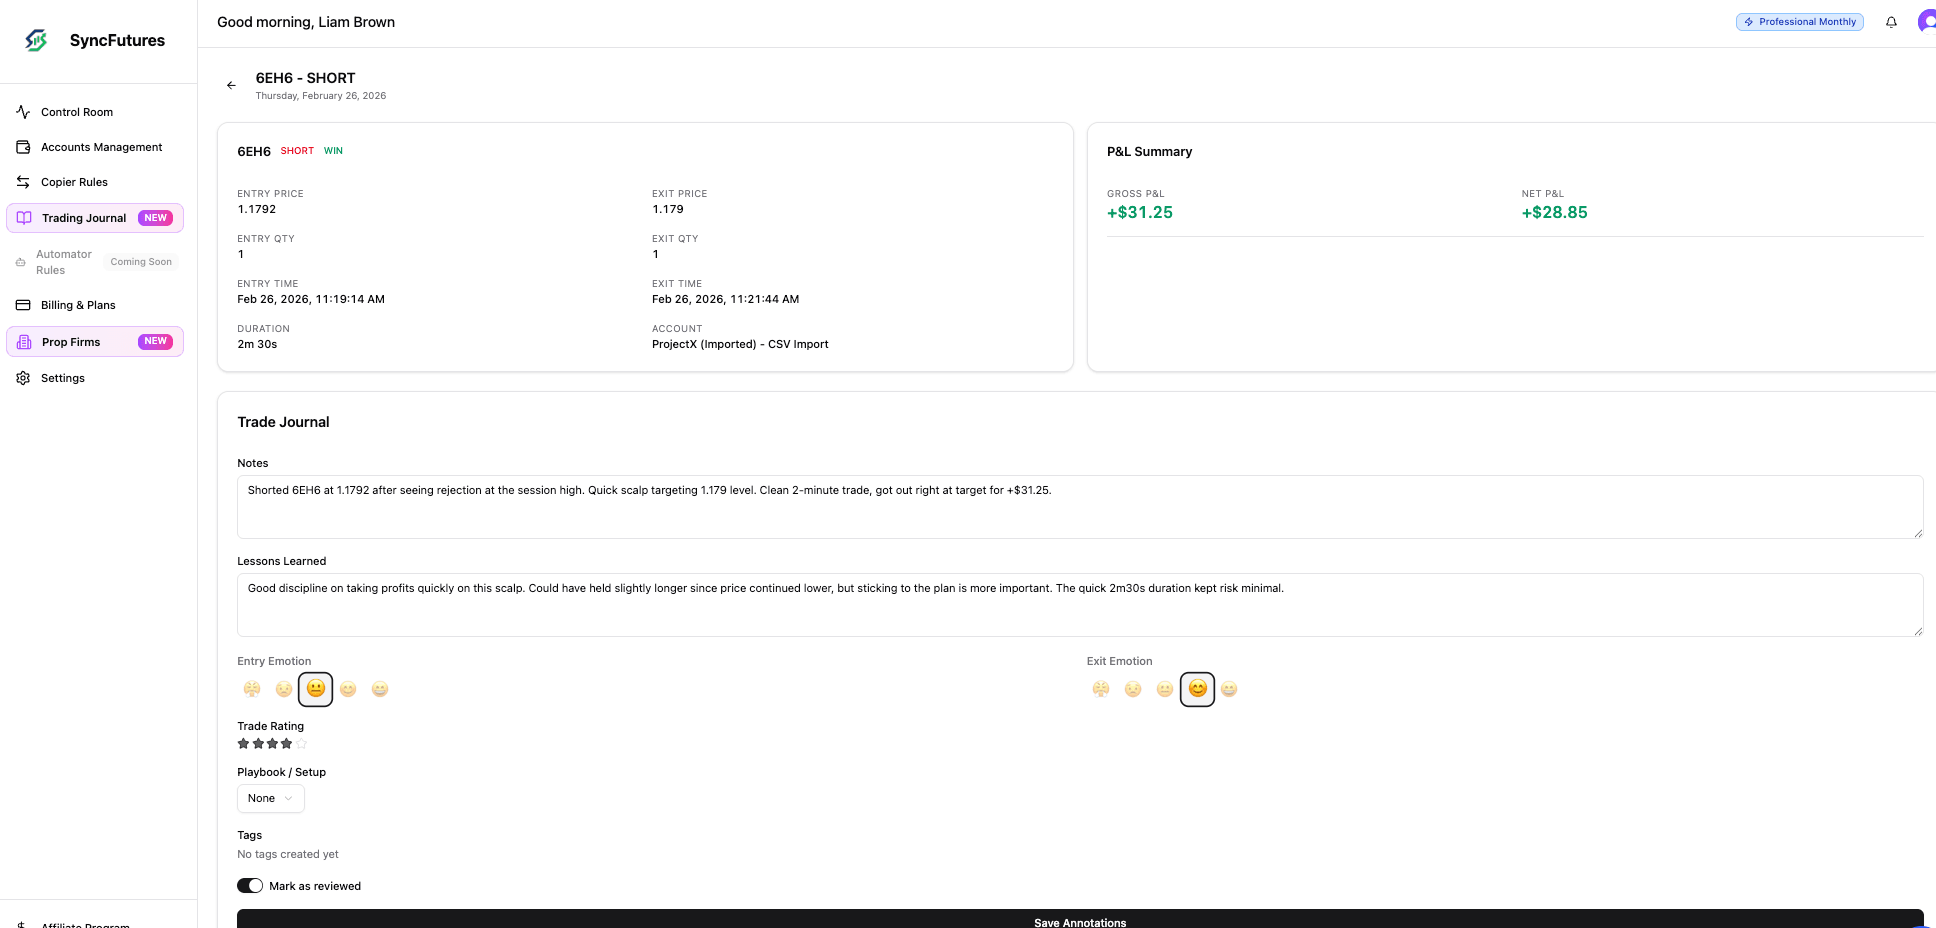
Trade Notes: Write down your reasoning before you know the outcome. Why did you enter? What was the setup? What was the market context? This creates an honest record of your decision-making process.
Lessons Learned: After the trade closes, what would you do differently? Even winning trades can have lessons—maybe you entered well but exited too early, or your thesis was wrong but you got lucky.
Emotional State: Rate your emotions at entry and exit. Were you calm and focused, or anxious and impulsive? Over hundreds of trades, this data reveals how emotions impact your P&L.
Trade Rating: Give each trade a quality score independent of the outcome. A well-executed trade that loses money is still a good trade. A sloppy trade that profits is still a bad trade. Rating trade quality separately from P&L trains you to focus on process over results.
Playbook/Setup: Categorize each trade by the setup type you used. "Break and retest," "opening range breakout," "VWAP bounce"—whatever your playbooks are. This lets you see which setups actually make you money vs. which ones you think are good.
Initial Risk (Your R Anchor): Record what you actually risked when you entered—the distance from entry to your stop, times your size and the contract's point value. This single number unlocks R-multiple analysis (more on that below), which is the cleanest way to compare a 2-point ES scalp against a 50-point NQ swing on equal footing.
Rule Adherence & Mistakes: After the trade, mark whether you followed your plan, and if not, why. Structured mistake categories—revenge trade, FOMO entry, moved stop, oversized, broke plan—turn vague self-criticism into countable, comparable data. This is the difference between "I traded badly this week" and "I revenge-traded four times and it cost me $1,180."
Tags: Custom labels for anything that matters to you. "A+ setup," "news-driven," "scaled in"—tags let you slice your data in ways that are meaningful to your specific trading style.
Here's what a well-annotated trade looks like in practice:
How to Review Your Trading Journal
Collecting data is only half the equation. The other half is reviewing it systematically. Here's a framework:
Daily Review (2 Minutes)
At the end of each trading day, go through your trades and add annotations while the memory is fresh. Don't overthink it—just capture:
- Why you took each trade
- How you felt during the trade
- One lesson from the day
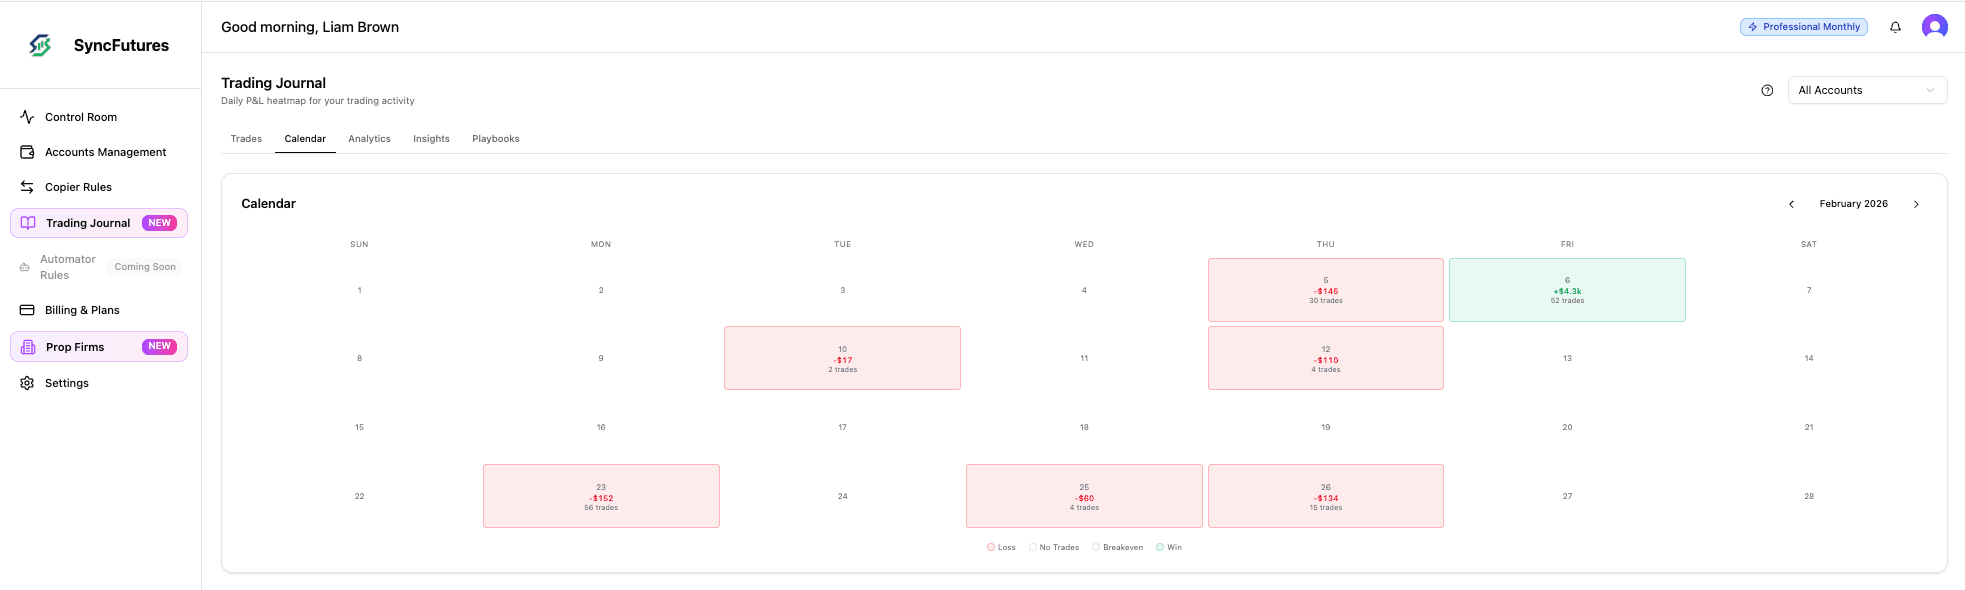
The calendar heatmap is perfect for this. One glance tells you whether today was green or red, how many trades you took, and how the current week is shaping up:
Weekly Review (15 Minutes)
Every weekend, look at the week's aggregate stats:
- Total P&L and number of trades
- Win rate and profit factor
- Best and worst trades—what can you learn from each?
- Did you follow your rules? How many "bad" trades did you take?
- Any patterns in timing, symbols, or emotions?
A weekly review works best when it's guided. SyncFutures' Weekly Reviews walk you through five structured prompts—what went well, what didn't, your biggest mistake, the one rule you'll change, and any free-form notes—and freeze a snapshot of that week's stats (net P&L, trade count, win rate) at the moment you save. Because the snapshot is locked, you get an honest record of how you actually felt about the week at the time, not a rosy reinterpretation after the next week goes well.
Monthly Deep Dive (30 Minutes)
Once a month, go deeper into the analytics:
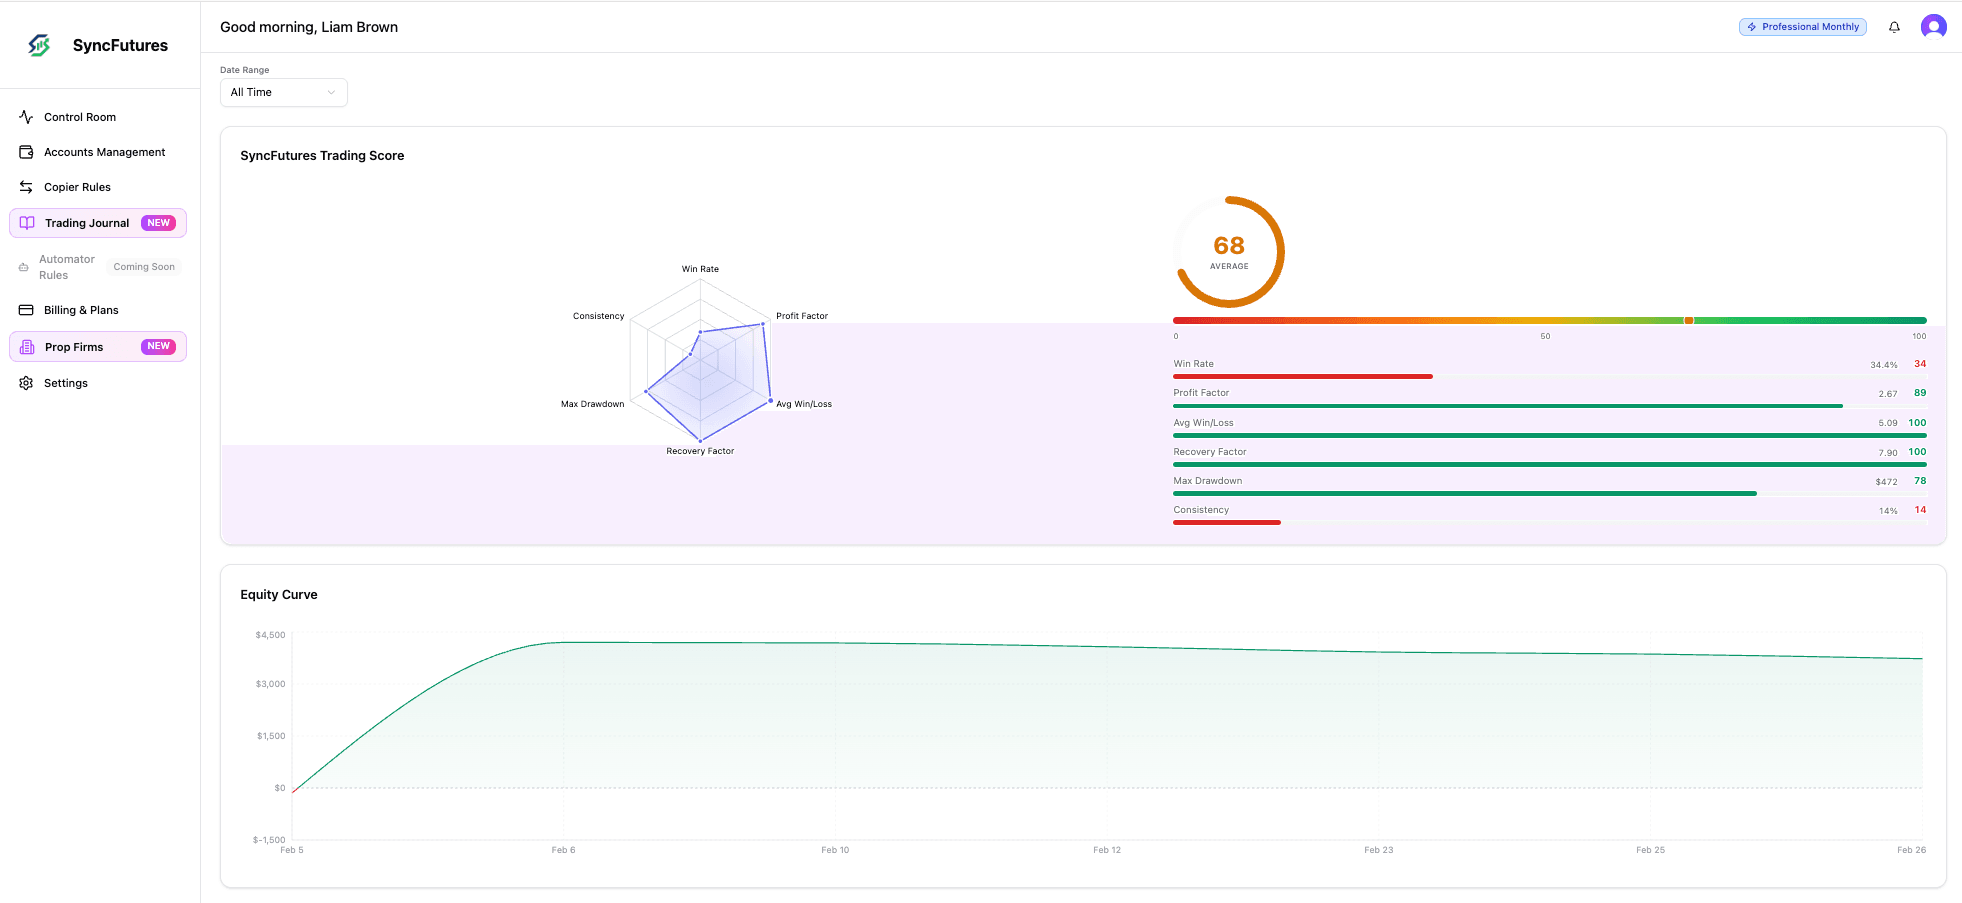
- Equity curve: Is your account trending up, or are you just churning? A flat equity curve with lots of activity means you have no edge and are just paying commissions.
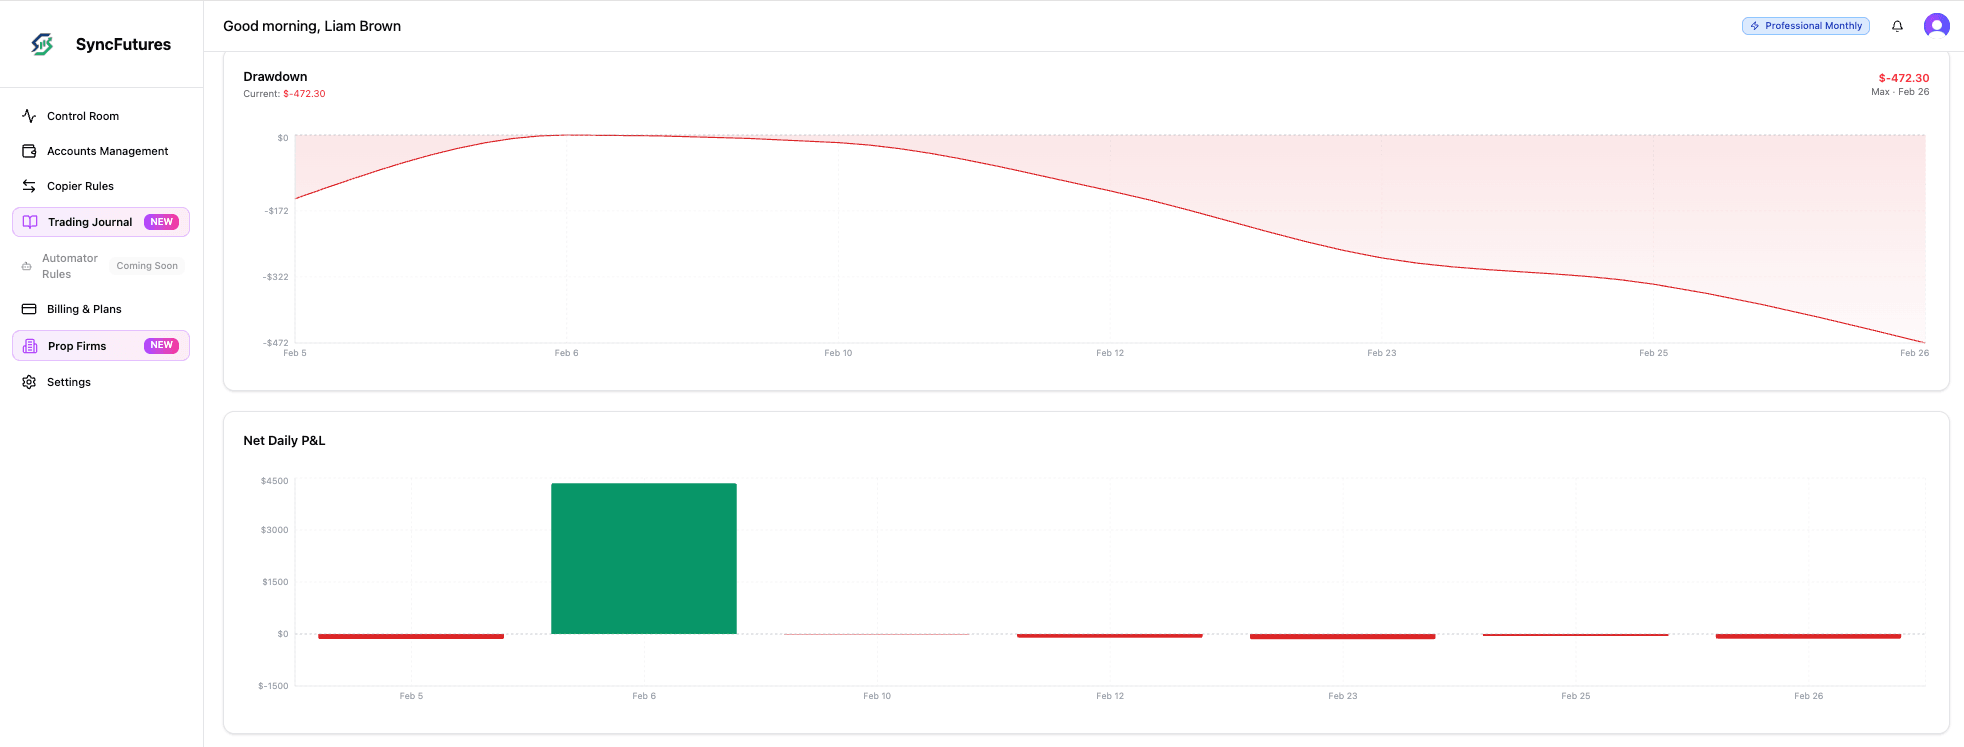
- Drawdown analysis: How deep are your drawdowns? How long do they last? Are they getting worse or better?
- Symbol breakdown: Which instruments are actually making you money?
- Time-of-day and session analysis: Are there hours you should stop trading? Do you trade the Asia, London, or New York session best?
- Setup performance: Which playbooks have positive expectancy? Which ones should you eliminate?
- Period comparison: Is this month actually better than last month—and in which specific metrics?
This is also the right time to use Compare Periods: put any two date ranges side by side (this month vs. last month, the week before a rule change vs. the week after) and read the deltas across every stat at once. It turns "I think I'm improving" into a row-by-row answer.
This is where analytics tools become invaluable. Doing this analysis in a spreadsheet takes hours. With proper trading journal software, it takes seconds:
Measuring Your True Edge: R-Multiple, Expectancy, and Risk of Ruin
Dollar P&L tells you what happened. It does not tell you whether your strategy is actually sound—a $500 winner where you risked $2,000 to make it is a worse trade than a $200 winner where you risked $100. To judge quality, you have to normalize for risk. That's what these three concepts do, and they're the foundation of how professional traders evaluate an edge.
R-Multiple: The Great Equalizer
An R-multiple expresses every trade's result as a multiple of what you risked on it. If you risked $100 (your "1R") and made $250, that's a +2.5R trade. If you lost the full $100, that's −1R. Risk $100 to make $250 on NQ, or risk $1,000 to make $2,500 on a basket of ES contracts—both are +2.5R. The dollar amounts are wildly different; the quality of the decision is identical.
This is why R-multiples are so powerful: they let you compare a small scalp to a large swing on a single, honest scale. A trader who consistently produces +2R winners and −1R losers has a real, describable edge—regardless of account size.
The catch is that R only means something if your risk number is honest. SyncFutures freezes your initial risk at entry—the distance from your entry to your stop, times your size and the contract's point value, captured the moment the trade is recorded. It is never silently recomputed if you later move your stop. That's deliberate: the whole point of R is "what did I risk when I took this trade?" Back-revising the denominator would defeat the metric. (Trades without a recorded stop simply stay "unanchored" and are excluded from R-based stats—nothing is fabricated.)
Expectancy: What One Trade Is Worth
Expectancy answers the most important question in trading: over the long run, how much do I expect to make—or lose—per trade? Expressed in R, it combines your win rate with the size of your average winner and loser:
Expectancy = (Win % × Average Win in R) − (Loss % × Average Loss in R)
A positive expectancy means that, on average, each trade you take adds to your account. A negative expectancy means you're bleeding out no matter how good any single week looks. A trader with a 45% win rate and +2R average winners against −1R losers has a positive expectancy and a genuine edge—even though they lose more often than they win.
SyncFutures computes your expectancy and shows your full R-distribution—how your trades spread across −2R, −1R, +1R, +2R, +3R, and beyond. The shape of that distribution tells you instantly whether you're a "lots of small wins, occasional big loss" trader (dangerous) or a "many small losses, occasional big win" trader (durable).
Edge Quality: Risk of Ruin, Kelly %, and K-Ratio
Once you have enough anchored trades, three higher-order metrics tell you how robust your edge really is:
- Risk of Ruin estimates the probability of blowing your account given your win rate and average win/loss sizes. A strategy can be profitable on paper and still carry an uncomfortable risk of ruin if the losers are too large relative to the wins. If your edge is negative, ruin is effectively certain—the number makes that brutally clear.
- Kelly % suggests the theoretical fraction of capital a pure-math optimizer would risk per trade to maximize long-run growth. It's an upper bound, not a recommendation—most traders deliberately trade a fraction of Kelly because full Kelly is gut-wrenchingly volatile. Seeing the number anchors your sizing conversation in reality.
- K-Ratio measures how steady your equity growth is, not just how high—it rewards a smooth, consistent climb and penalizes a jagged, lucky one. Two traders can finish the month at the same P&L; the one with the higher K-Ratio got there with far less white-knuckle volatility.
These are theoretical, model-based estimates—simplifying assumptions and all—so SyncFutures only surfaces them once you have at least 20 anchored trades. Below that, the sample is too small to mean anything, and we tell you so rather than show you a misleading number.
From Mistakes to Discipline: Rule Adherence and Edge Leak
Most traders already know their strategy works. What kills them is the gap between the plan and the execution—the revenge trade after a loss, the stop they widened "just this once," the position they sized up after three wins. The job of a great journal isn't just to measure your edge; it's to measure how much of that edge you're throwing away.
Tag the Mistake, Not Just the Loss
On every trade you can mark whether you followed your rules—a simple yes/no/not-reviewed—and attach one or more structured mistake tags from a fixed taxonomy:
Revenge trade · FOMO entry · Moved stop · Broke plan · Oversized · Undersized · Late entry · Early exit · No plan · Overtrading
Because the tags are a fixed vocabulary rather than free-form text, they're countable and comparable. You can finally answer questions like "How often do I move my stop, and what does it cost me?" instead of scrolling through a hundred one-off notes.
Edge Leak: The Price of Indiscipline, in Dollars
Here's the metric that changes behavior. Edge Leak adds up the net P&L of every trade you flagged as a rule violation and shows you the headline figure:
"You'd be +$1,840 if you'd followed your rules."
It also breaks the leak down by mistake type, so you can see whether your money is leaking out through revenge trades, oversizing, or chasing entries. Nothing is more motivating than seeing a single dollar amount that represents the gap between the trader you are and the trader you already know how to be. That number is your most reachable source of improvement—no new strategy required.
Setting Goals and Loss Limits
A journal that only looks backward is half a tool. SyncFutures lets you set per-account goals—daily, weekly, and monthly P&L targets—and loss limits for both the day and the week, then tracks your progress against them in a dedicated widget. Set them globally across all accounts or per individual account.
The weekly loss limit deserves a special mention: it catches the slow-bleed pattern where you stay under your daily limit every single day but still lose meaningfully across a Tuesday–Wednesday–Thursday losing streak. It's a circuit-breaker signal your daily number simply can't give you.
One important clarification, because we never want to overstate what the software does: these goals and limits are informational. They mirror the rule structure many prop firms enforce externally so you can self-monitor against them—but SyncFutures does not auto-flatten your positions or disconnect you when a limit is hit. The discipline stays in your hands; the journal just makes the line impossible to ignore.
The Problem with Spreadsheets and Manual Journals
Let's be honest: most traders who try journaling start with a spreadsheet. And most of them quit within two weeks. Here's why:
Manual Entry Is a Motivation Killer
After a long trading session, the last thing you want to do is manually type in every trade's entry price, exit price, quantity, time, and P&L. For a trader taking 5-10 trades per day across multiple accounts, that's 30-60 minutes of data entry. Every single day.
This is unsustainable. The journal that doesn't get filled out is worthless, no matter how well-designed your spreadsheet is.
Spreadsheets Can't Do Behavioral Analytics
A spreadsheet can calculate your win rate and total P&L. But can it tell you:
- How your performance changes after a 3-trade winning streak?
- Whether your emotional state at entry correlates with trade outcomes?
- What your optimal trade duration is for each symbol?
- How your win rate varies by time of day, adjusted for Eastern Time?
These are the insights that actually change your trading. And they require specialized analytics that spreadsheets simply can't provide efficiently.
No Visual Feedback Loop
Humans are visual creatures. A wall of numbers in a spreadsheet doesn't trigger the same behavioral response as seeing a red-filled calendar week or a declining equity curve. Visual tools like heatmaps, charts, and score cards create emotional impact that drives behavior change.
How a Trading Journal Should Actually Work
The best trading journal software removes friction and adds insight. Here's what that looks like in practice:
Automatic Trade Capture
Your trades should flow into your journal automatically. Whether you're syncing from a connected broker or importing historical trades via CSV, the goal is zero manual data entry for the trade data itself.
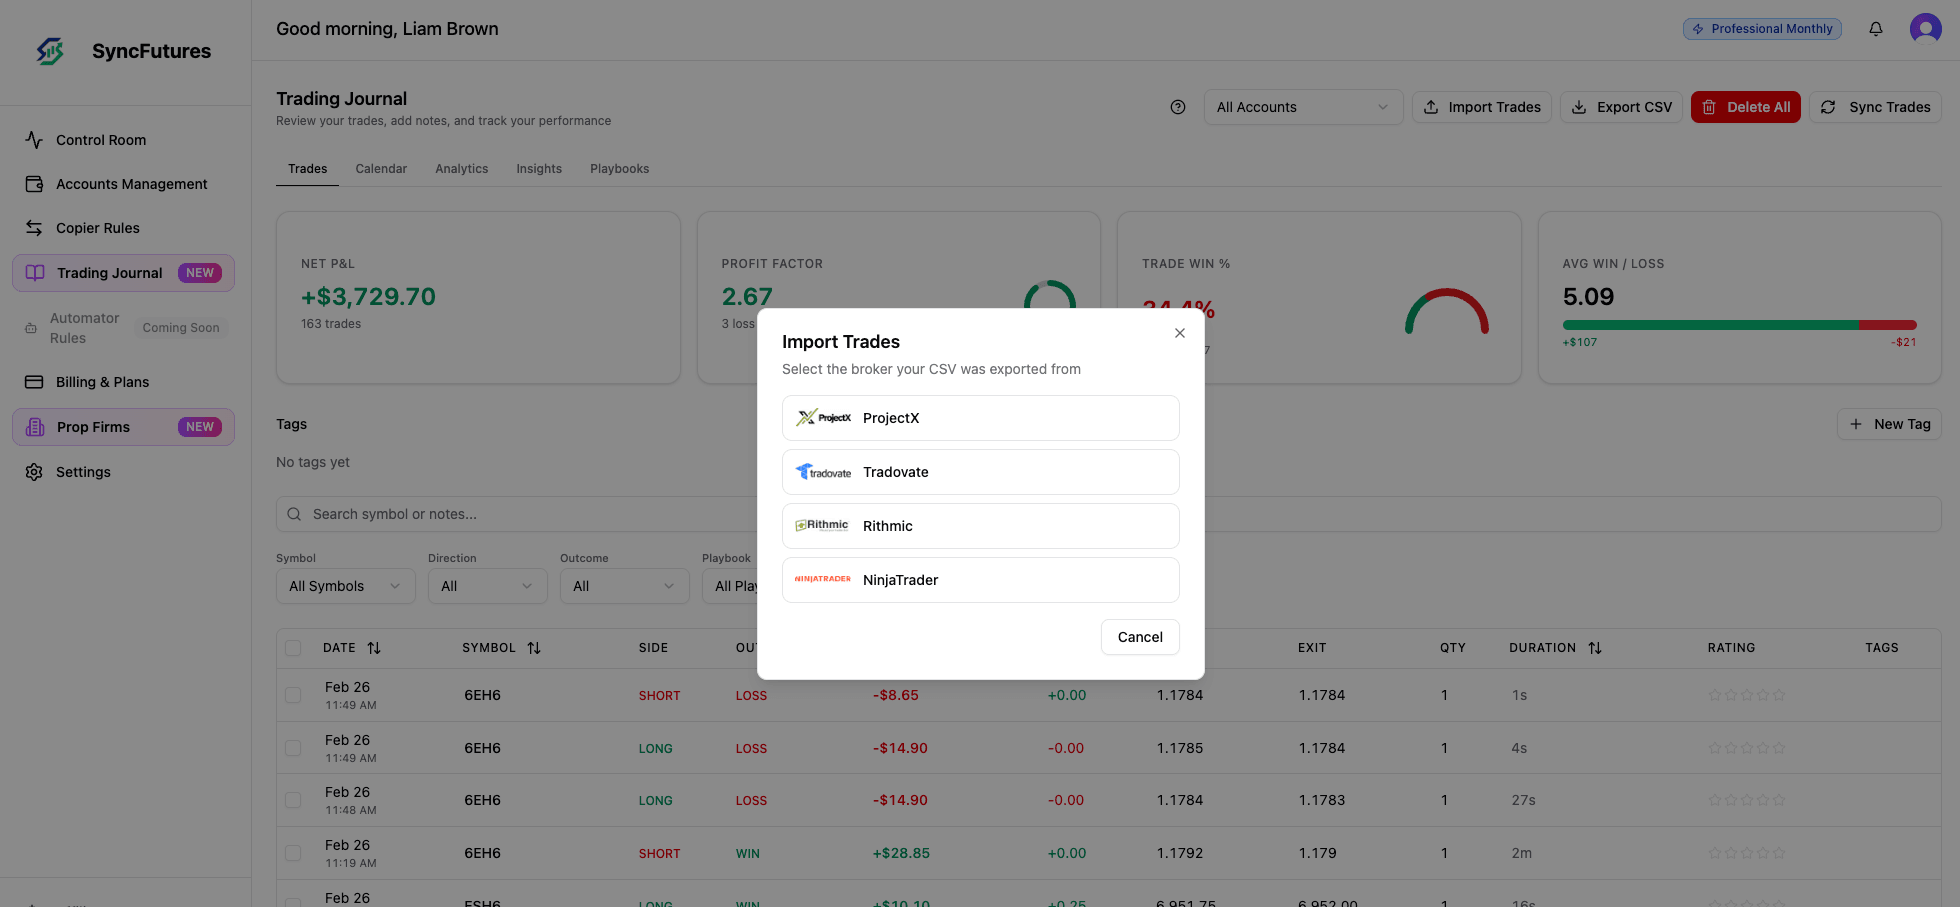
SyncFutures supports importing trades from Rithmic, Tradovate, NinjaTrader, and ProjectX—covering virtually every futures broker and prop firm. You can also import historical trades from CSV files to backfill your journal with past data.
For traders using SyncFutures' trade copier, your completed trades sync automatically into your journal without lifting a finger.
Smart Filtering and Organization
With hundreds or thousands of trades, you need powerful filtering to find what matters. Filter by symbol, direction, outcome, playbook, tags, date range, or review status. Search through your notes to find specific trade setups you've written about.
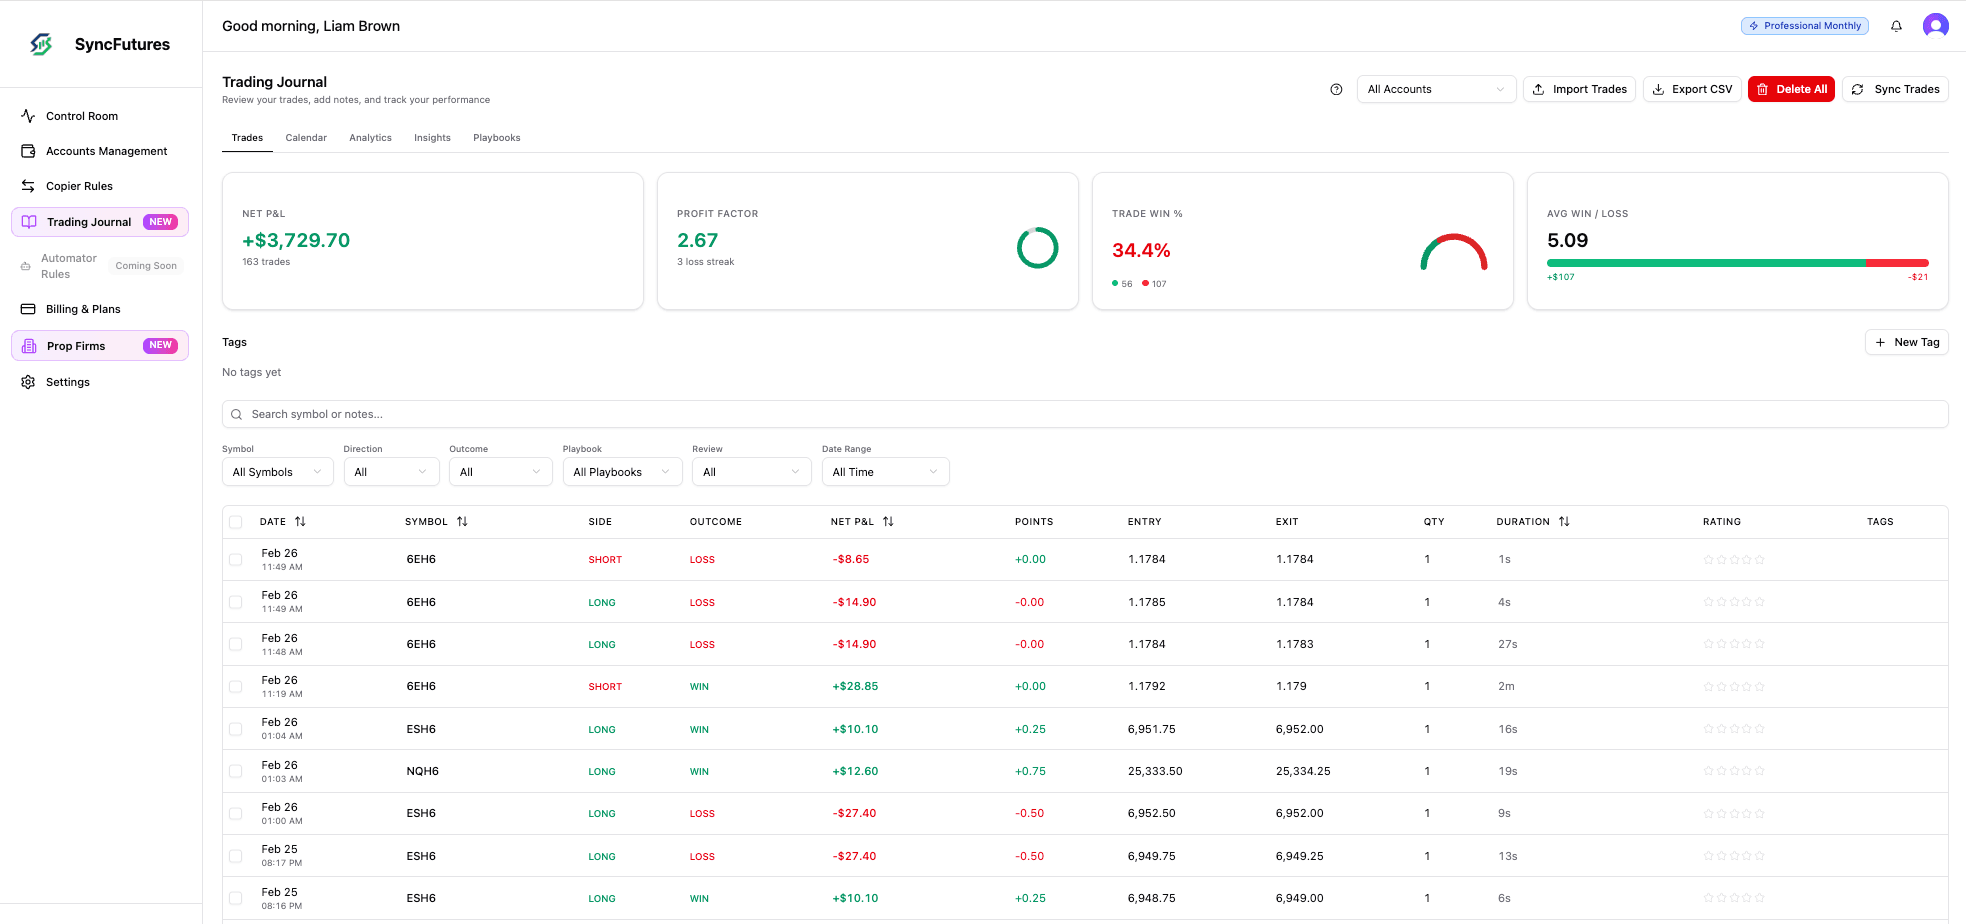
Analytics That Answer Real Questions
Your journal should answer questions like:
- "Am I actually profitable, or just busy?" → Equity curve
- "How bad can my drawdowns get?" → Drawdown chart
- "Which day of the week is my best?" → Day-of-week breakdown
- "Should I stop trading after lunch?" → Time-of-day analysis (ET)
- "Which session suits me—Asia, London, or New York?" → Session breakdown
- "Do I hold trades too long?" → Duration breakdown
- "Is my edge real, or just a lucky streak?" → Expectancy & R-distribution
- "What's my single most profitable setup—and my worst?" → Best & Worst Setups leaderboard
All of these should be available with one click, filtered by account and date range.
One feature worth calling out is the Best & Worst Setups leaderboard. Instead of looking at one axis at a time, it ranks combinations—playbook × session, playbook × day-of-week, symbol × session, symbol × day-of-week—so you discover things like "my opening-range breakout is a money-maker in the NY session but a money-loser in London." It filters out low-sample flukes so a single lucky trade doesn't top the chart. That's a level of cross-referencing that's effectively impossible to do by hand.
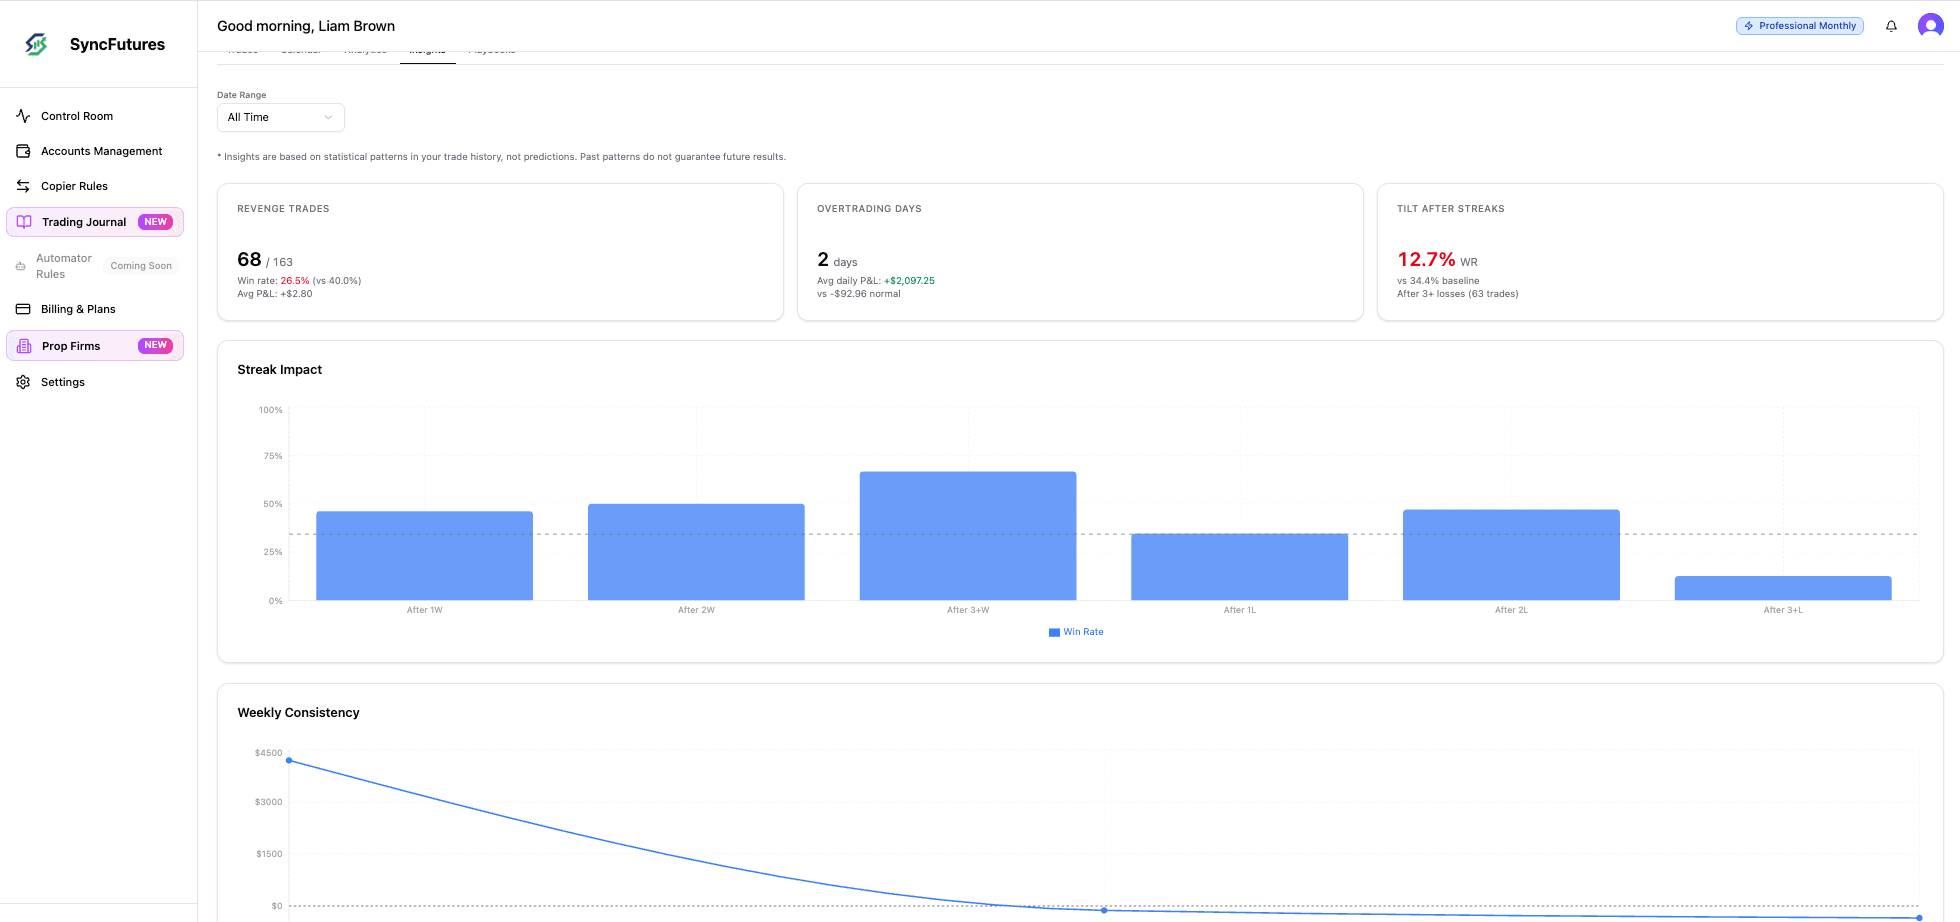
Behavioral Insights That Change Your Trading
Beyond standard analytics, the most valuable insights are behavioral—patterns in how your psychology affects your results:
- Streak impact: After 3 wins in a row, does your win rate go up or down? (For most traders, it drops—overconfidence kicks in.)
- Consistency score: Are you following your rules, or is your execution all over the place?
- Emotional correlation: Do trades entered with calm confidence outperform trades entered with anxiety?
- Revenge trading detection: Are you jumping back in too quickly after losses?
These insights are nearly impossible to extract from a spreadsheet. They require aggregating hundreds of data points and cross-referencing multiple variables. But they're the insights that separate a trader who journals from a trader who improves from journaling.
An AI Coach Grounded in Your Own Numbers
A journal that already aggregates your stats can do one more thing: explain them in plain language. SyncFutures includes Synca, an AI trading coach that reads your real, synced trades and helps you make sense of them—where your edge is, why you're losing on a given symbol, and what to work on next. The statistics it talks about are computed from your journal, so the numbers stay accurate; the AI's job is to explain them, not invent them.
Every plan includes one free Synca insight each week. An optional add-on ($14/month, 500 AI credits) unlocks a fresh insight every trading day plus the ability to chat with Synca about your own trading. It's educational—coaching on your past trades, not signals or financial advice.
Building a Journaling Habit That Sticks
Knowing you should journal and actually doing it consistently are two very different things. Here's how to make it stick:
1. Automate Everything You Can
The number one reason traders stop journaling is friction. If it takes 30 minutes to log your trades, you'll skip it when you're tired, frustrated, or in a rush. Automate the data capture so the only manual work is writing your notes and reflections—the part that actually requires your brain.
2. Start With Just One Field
If writing detailed notes for every trade feels overwhelming, start with just one thing: a trade rating (1-5 stars). Was this a good trade or a bad trade, regardless of outcome? You can always add more detail later. The habit matters more than the completeness.
3. Review on a Schedule
Put your weekly and monthly reviews on your calendar. Treat them like appointments you can't cancel. The review is where the compounding happens—where patterns emerge and behavior changes.
4. Focus on Process, Not Outcome
When reviewing your journal, resist the urge to focus only on P&L. Look at trade quality ratings, rule adherence, and emotional patterns. A week of well-executed trades that happened to lose money is better than a week of sloppy trades that happened to profit. The journal helps you see the difference.
5. Use Your Lessons Learned
This sounds obvious, but most traders write lessons and never read them again. Before each trading session, spend 60 seconds reading your last few "Lessons Learned" entries. This primes your brain with recent insights and makes you less likely to repeat mistakes.
Common Journaling Mistakes
Mistake #1: Only Journaling Winning Trades
It's human nature to want to remember the wins and forget the losses. But your losing trades contain more actionable information than your winners. Force yourself to annotate every trade, especially the painful ones.
Mistake #2: Writing Outcomes, Not Process
"Bought NQ, made $500" is useless as a journal entry. Write about your decision-making process: What did you see? What was your plan? Where was your stop? Why did you choose that size? This is the data that helps you improve.
Mistake #3: Never Reviewing
A journal you write in but never review is just a diary. The value is in the review. Set a weekly reminder and actually look at your data. Patterns that are invisible in daily trading become obvious in weekly and monthly reviews.
Mistake #4: Over-Complicating It
Some traders create elaborate 30-field journal templates with market structure analysis, multi-timeframe confluence scores, and detailed pre-trade checklists. Then they burn out in a week. Start simple and add complexity only when you find yourself wanting more data, not before.
Mistake #5: Ignoring Emotional Data
Many traders track entries, exits, and P&L but skip the emotional component entirely. Yet emotions are often the primary driver of poor decisions. Tracking how you feel at entry and exit—even with a simple emoji scale—reveals patterns that pure P&L data never will.
Frequently Asked Questions
Q: How long should I spend journaling each day?
A: With automatic trade capture, 5-10 minutes per day is enough for annotations. The key is consistency—5 minutes every day beats an hour once a week. Use the time right after your trading session when the details are fresh.
Q: Should I journal paper trades and sim trades?
A: Yes. Journaling sim trades builds the habit before real money is on the line, and it gives you baseline data about your strategy's performance. When you transition to live trading, you'll already have a journaling system in place and historical data to compare against.
Q: What's the minimum number of trades before journal analytics become useful?
A: You'll start seeing directional patterns after 30-50 trades. Statistical significance for things like win rate by symbol or time of day typically requires 100+ trades. Behavioral insights like streak impact need 200+ trades. The sooner you start, the sooner the data becomes actionable.
Q: I trade multiple prop firm accounts. Should I journal each account separately?
A: If you're using a trade copier and all accounts mirror the same trades, journal them as a single strategy. You don't need to annotate the same trade 10 times. Filter by account when you need to check individual account P&L for rule compliance, but your strategic review should look at the aggregate.
Q: Can I import my historical trades from another platform?
A: Yes. Most trading journal software supports CSV import from major brokers. This lets you backfill your journal with historical data so you can start analyzing patterns immediately instead of waiting months to accumulate new trades.
Q: Should I journal every trade, even scalps?
A: Log every trade for the quantitative data (P&L, duration, etc.)—this should be automatic. For annotations, focus your energy on trades that were significant: your biggest wins, biggest losses, trades where you broke your rules, and trades where you executed perfectly. Not every 30-second scalp needs a paragraph of notes.
Q: What is an R-multiple, and why does it matter more than dollar P&L?
A: An R-multiple expresses each trade's result as a multiple of what you risked on it—risk $100, make $250, and that's a +2.5R trade. It lets you compare trades of completely different sizes on one honest scale and is the basis for expectancy (your expected return per trade) and Risk of Ruin. Dollar P&L tells you what happened; R tells you whether the decision was good. To get accurate R-multiples, record your stop so SyncFutures can anchor your initial risk at entry—trades without a stop simply stay excluded from R-based stats.
Q: Will the journal stop me from trading if I hit my loss limit?
A: No. The goals and loss limits in SyncFutures are informational—they mirror the rule structure prop firms enforce so you can self-monitor against them, but the journal does not auto-flatten positions or disconnect you when a limit is reached. It surfaces the breach clearly; the discipline to act on it stays with you.
Start Building Your Trading Edge Today
The traders who consistently profit from futures markets aren't smarter than you. They're not using a secret indicator. They simply know themselves better—their strengths, their weaknesses, their emotional triggers, and their true edge. A trading journal is how they built that self-knowledge.
Every day you trade without journaling is data you'll never get back. Patterns are forming in your trading right now—patterns that could make you significantly more profitable—but without a journal, they'll remain invisible.
SyncFutures' built-in trading journal eliminates the friction that kills most journaling habits:
- Automatic trade sync from Tradovate, Rithmic, NinjaTrader, and ProjectX
- CSV import for historical trades from supported brokers
- Calendar heatmap with monthly P&L for instant performance feedback
- Advanced analytics: equity curve, drawdown, P&L distribution, time-of-day, day-of-week, and trading-session (Asia / London / NY) breakdowns
- Risk & expectancy: R-multiple tracking, expectancy, R-distribution, and Edge Quality (Risk of Ruin / Kelly % / K-Ratio)
- Best & Worst Setups leaderboard and Compare Periods for A/B-ing any two date ranges
- Behavioral insights: streak impact, consistency scoring, and emotional pattern analysis
- Self-coaching loop: structured mistake tags, a Followed-rules flag, Edge Leak, and guided Weekly Reviews
- Goals & loss limits: per-account daily/weekly/monthly targets and loss limits (informational—no auto-stop)
- Rich annotations: notes, lessons learned, emotions, ratings, playbooks, and custom tags
- Multi-account support with per-account and master-accounts-only filtering—perfect for prop firm and copy-trading traders
Stop guessing. Start measuring. Your future self will thank you for the data you collect today.
SyncFutures' trading journal is included free with every plan — no extra cost, no add-ons. Subscribe and start journaling from day one.